Profiling a PHP script with XDebug
Software profiling is a powerful technique when you want to optimize your code. Among other things, a profile snapshot will show you which parts of your software are the slower.
In this article I will explain how to create a profile snapshot for a PHP script.
Requirements
I assume you are using Ubuntu and you already have PHP installed. Please also install XDebug 3 and KCachegrind:
$ apt install php-xdebug
$ apt install kcachegrind
Create profile file
As an example, I will profile tests from jawira/plantuml-encoding.
$ git clone https://github.com/jawira/plantuml-encoding.git
$ cd plantuml-encoding
$ php tests/vanilla.php
Execute the following command to profile tests/vanilla.php:
$ php -dxdebug.mode=profile -dxdebug.output_dir=. tests/vanilla.php
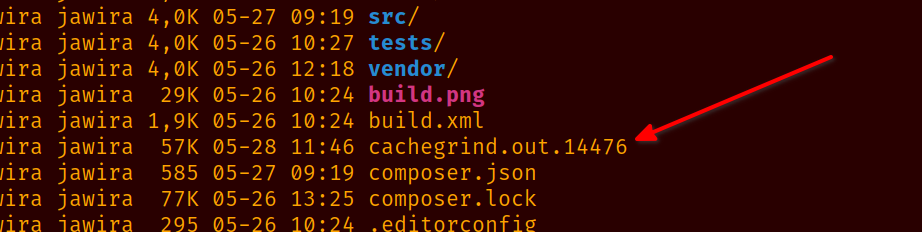
After the execution is finished, a new profile snapshot will be created. This
profile file has the following name pattern cachegrind.out.xxxxx
(where xxxxx is a number).
XDebug can be configured in php.ini. Here we have configured XDebug
on-the-fly passing php.ini configuration through the terminal.
- -dxdebug.mode=profile: This option makes
profile modeenabled for this command. - -dxdebug.output_dir=.: Save profile snapshots in current dir “
.”, otherwise snapshots are saved in/tmp.
In our case profiling mode is ephemeral, but it can be a problem if you are
activating profiling by other means (for example directly editing php.ini
file). Profile snapshots can take a LOT of disk space, never leave profile mode
permanently enabled.
Opening profile file
To visualize your profile snapshot, simply open the snapshot (in our
case cachegrind.out.14476) with KCachegrind.
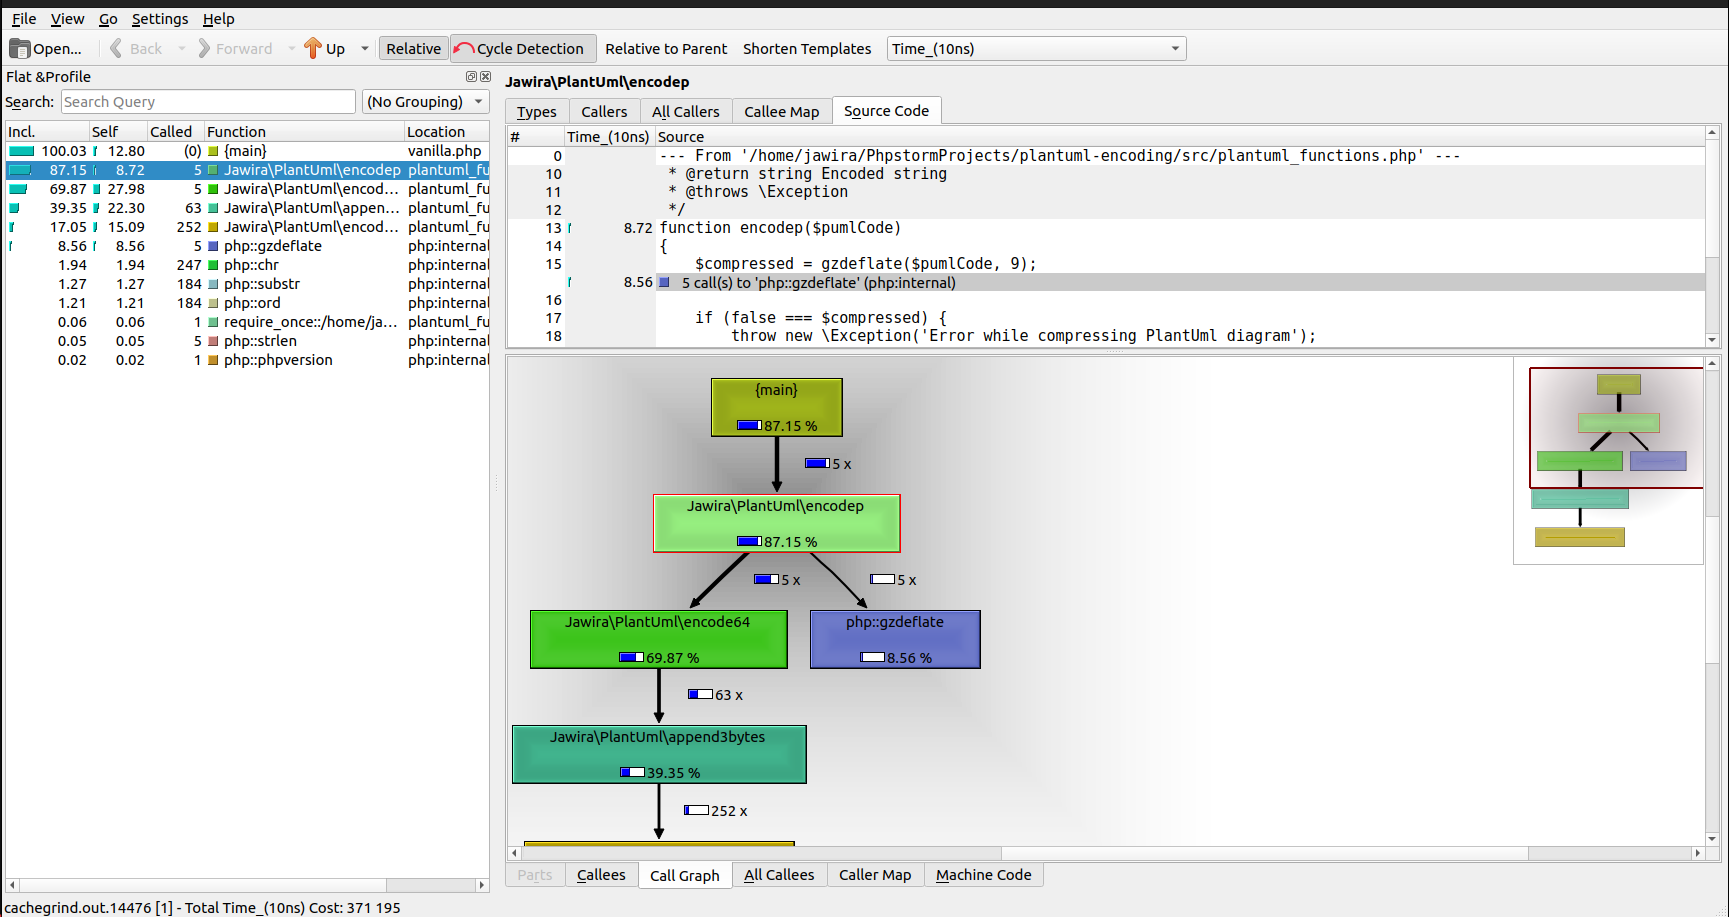
The reading and interpretation of profiling files are beyond the scope of this article, yet I recommend you to see this video https://www.youtube.com/watch?v=h-0HpCblt3A presenting KCachegrind.
Conclusion
Creating a profile snapshot is easy if you understand how to configure XDebug
properly. Using -d options is very convenient technique to enable profiling
from the terminal.
Resources
- https://xdebug.org/docs/profiler
- http://kcachegrind.github.io/html/Documentation.html